forexeasourcecodes
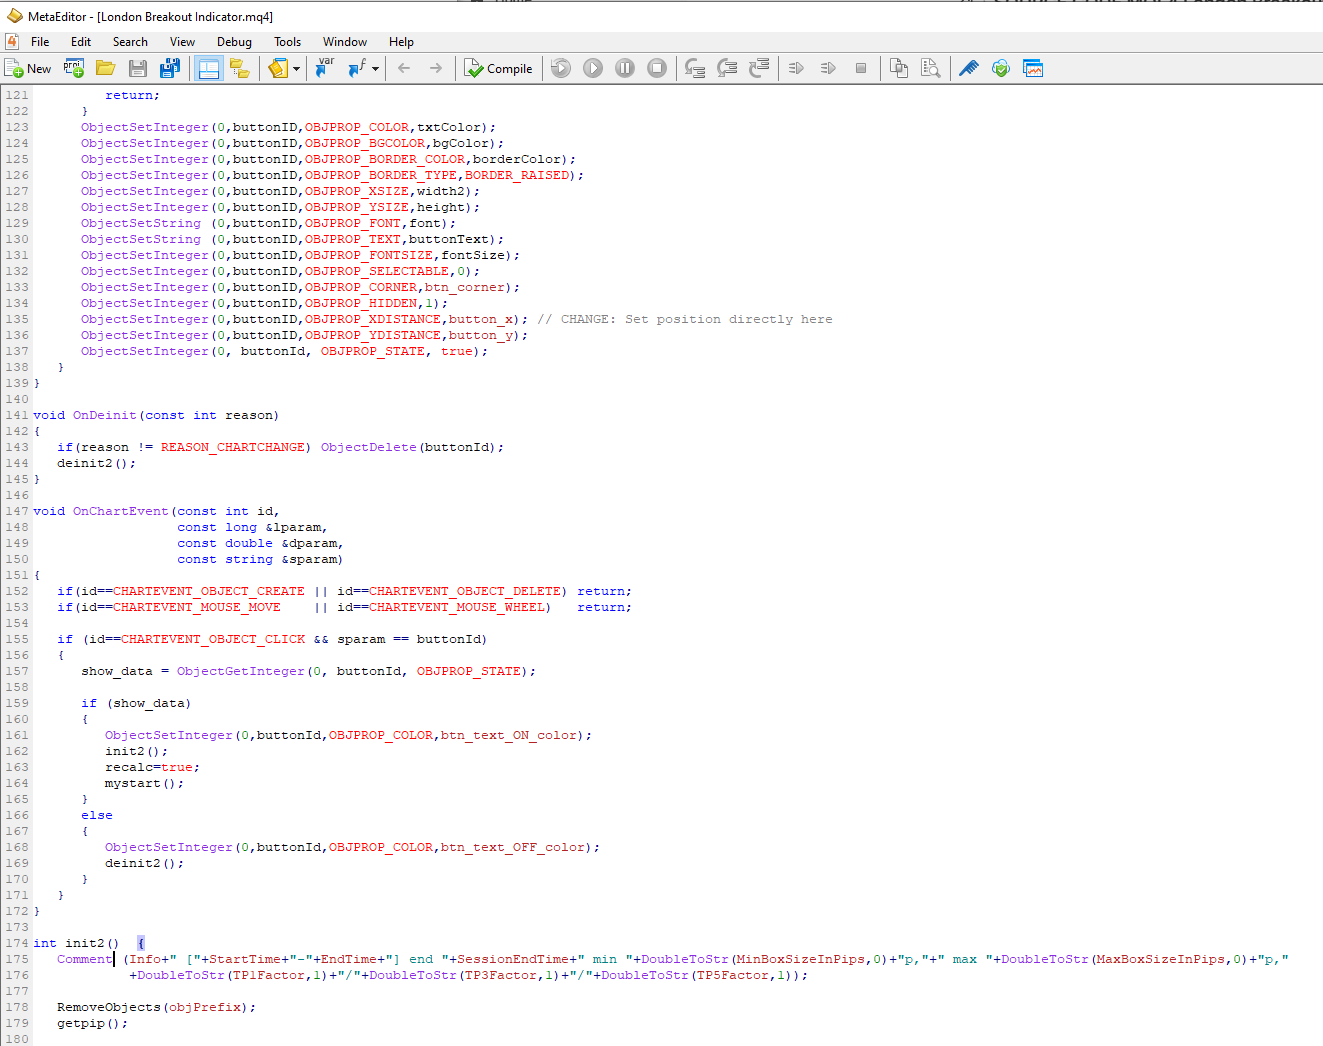
SOURCE CODE MQL4 London Breakout Indicator
SOURCE CODE MQL4 London Breakout Indicator
Couldn't load pickup availability
1. London Breakout Strategy
This is a popular strategy that capitalizes on the increased volatility at the start of the London session, often seen in currency pairs like GBP/USD, EUR/USD, or GBP/JPY. The provided MQL4 indicator is designed to automate this strategy by identifying breakout levels based on a pre-London price range.
Concept
Premise: Before the London session begins, price action is often consolidated during the Asian session (low volatility). The London open triggers increased volume, causing breakouts from the Asian session range.
Objective: Identify the high and low of a predefined range (e.g., 6:00 AM to 8:00 AM GMT) and trade breakouts above the high (buy) or below the low (sell).
How It Works
Define the Range:
Set a time window before the London open (e.g., 6:00 AM to 8:00 AM GMT, as in your code with StartTime and EndTime).
Identify the highest high (boxHigh) and lowest low (boxLow) within this period to form the breakout range.
Your indicator uses parameters like MinBoxSizeInPips (15 pips) and MaxBoxSizeInPips (80 pips) to filter valid ranges.
Entry Rules:
Buy: Enter a long position when the price breaks above the range high (BuyEntry) with confirmation (e.g., a close above the level or a breakout arrow from your indicator).
Sell: Enter a short position when the price breaks below the range low (SellEntry) with confirmation.
Example from your code: The indicator plots breakout arrows (ShowBreakoutArrow) when the price crosses BuyEntry or SellEntry.
Take-Profit and Stop-Loss:
Take-Profit: Use Fibonacci-based levels or multiples of the range size (e.g., TP1Factor = 1.0, TP3Factor = 2.618, TP5Factor = 4.236 in your code). For example, TP1 might be 1x the range size (e.g., 20 pips if the range is 20 pips).
Stop-Loss: Place below the range low for buys or above the range high for sells, often using SLFactor (e.g., 1x the range size).
Your code calculates BuyTP1, BuyTP2, etc., and BuySL/SellSL dynamically based on the range (boxExtent).
Exit Rules:
Exit at predefined take-profit levels (e.g., BuyTP5 or SellTP5 for extended moves).
Alternatively, exit at the end of the London session (SessionEndTime, e.g., 4:30 AM next day in your code) to avoid holding positions into lower volatility periods.
Your indicator marks TP5 crosses (ShowTP5Cross) to signal potential exits.
Tips for Implementation
Timeframe: Use M15 or M30 charts for clearer signals, as your indicator operates on the current chart timeframe.
Pairs: Focus on GBP/USD, EUR/USD, or GBP/JPY due to their volatility during London hours.
Filters: Use MinBoxSizeInPips and MaxBoxSizeInPips to avoid trading in overly tight or wide ranges, as your indicator does (e.g., no trade if range 80 pips).
Confirmation: Add a momentum indicator (e.g., RSI or MACD) to confirm breakouts and avoid false signals.
Risk Management: Risk 1-2% of your account per trade, with stop-losses based on the range size.
Example Using Your Indicator
Setup: On GBP/USD M15, the indicator identifies a 6:00 AM–8:00 AM GMT range with boxHigh = 1.3000 and boxLow = 1.2980 (20 pips).
Entry: Price breaks above 1.3000 at 8:15 AM GMT, triggering a buy arrow (BuyArrowColor = clrLime).
Targets: BuyTP1 = 1.3020 (20 pips), BuyTP3 = 1.3052 (52 pips, based on TP3Factor = 2.618), BuySL = 1.2980 (20 pips below entry).
Exit: Close at TP1, TP3, or if price hits BuyTP5 (marked by a red cross if ShowTP5Cross = true).
Pros and Cons
Pros: High-probability setups during volatile periods; clear rules automated by your indicator.
Cons: False breakouts can occur; requires strict risk management.
2. London Open Trend Continuation Strategy
This strategy focuses on trading in the direction of the prevailing trend during the London session, leveraging the session’s momentum.
Concept
Premise: The London session often amplifies existing trends from the Asian session or prior day. Identify the trend and enter on pullbacks or breakouts in the trend direction.
Objective: Ride the trend with entries during pullbacks or confirmed breakouts.
How It Works
Identify the Trend:
Use a higher timeframe (e.g., H4 or D1) to determine the trend using moving averages (e.g., 50 EMA > 200 EMA for bullish, vice versa for bearish).
Alternatively, use price action (higher highs/higher lows for bullish).
Entry Rules:
Buy: In an uptrend, enter on a pullback to a support level, moving average (e.g., 20 EMA on M15), or after a breakout above a consolidation zone during the London open.
Sell: In a downtrend, enter on a pullback to resistance or after a breakdown below support.
Example: If GBP/USD is in an H4 uptrend, wait for a pullback to the 20 EMA on M15 at 8:30 AM GMT and enter long if price bounces.
Take-Profit and Stop-Loss:
Take-Profit: Target the next significant resistance/support level or use a risk-reward ratio (e.g., 2:1 or 3:1).
Stop-Loss: Place below the recent swing low (for buys) or above the swing high (for sells).
Example: For a buy at 1.3000, set TP at 1.3050 (50 pips) and SL at 1.2975 (25 pips).
Exit Rules:
Exit at the target, or trail the stop using a moving average or ATR-based trailing stop.
Consider exiting before the New York session (11:00 AM EST) if volatility subsides.
Tips for Implementation
Timeframe: Use H4 for trend direction, M15/M5 for entries.
Pairs: GBP/USD, EUR/USD, USD/JPY, or GBP/JPY for strong trends.
Indicators: Combine with your breakout indicator by using BuyEntry/SellEntry levels as additional confirmation for trend-aligned breakouts.
Avoid Choppy Markets: Skip trading if the Asian session shows no clear trend or tight consolidation.
Pros and Cons
Pros: Captures strong moves in trending markets; aligns with broader market direction.
Cons: Requires accurate trend identification; pullbacks may be shallow in strong trends.
3. London Session Range Reversal Strategy
This strategy trades reversals within the London session when price reaches key support or resistance levels, especially after an initial breakout fails.
Concept
Premise: After the initial London open volatility, price often tests key levels (e.g., daily pivot points, Fibonacci levels, or prior session highs/lows) and reverses if momentum fades.
Objective: Enter trades at overextended levels expecting a reversion to the mean.
How It Works
Identify Key Levels:
Use pivot points, Fibonacci retracement levels (e.g., 61.8% or 78.6%), or prior day highs/lows.
Your indicator’s Fibonacci levels (OBJ_FIBO with TP1Factor, TP3Factor, etc.) can help identify potential reversal zones.
Entry Rules:
Buy: Enter when price tests a strong support level (e.g., daily S1 pivot or SellTP3 from your indicator) with bullish confirmation (e.g., candlestick patterns like pin bars or engulfing candles).
Sell: Enter at resistance (e.g., daily R1 or BuyTP3) with bearish confirmation.
Example: If EUR/USD hits BuyTP5 (e.g., 1.1200) and forms a double top with RSI divergence, enter a short.
Take-Profit and Stop-Loss:
Take-Profit: Target the middle of the range (e.g., boxMedianPrice from your indicator) or the opposite breakout level (BuyEntry/SellEntry).
Stop-Loss: Place above the resistance (for sells) or below the support (for buys), typically 1-1.5x the ATR.
Example: Short at 1.1200, TP at 1.1150 (50 pips), SL at 1.1225 (25 pips).
Exit Rules:
Exit at the target or if a breakout occurs in the opposite direction (e.g., price breaks BuyEntry after a short trade).
Your indicator’s TP5 cross (TP5CrossColor) can signal potential reversals or exits.
Tips for Implementation
Timeframe: M15 or M30 for identifying reversals.
Pairs: EUR/USD, GBP/USD, or USD/CHF for well-defined ranges.
Confirmation: Use RSI (>70 for sells, <30 for buys) or candlestick patterns for confirmation.
Avoid Overtrading: Focus on high-probability setups at major levels.
Pros and Cons
Pros: Good for range-bound markets; leverages overextended moves.
Cons: Risk of getting caught in strong breakouts; requires precise level identification.
4. London-New York Overlap Strategy
The overlap between the London and New York sessions (8:00 AM to 11:00 AM EST) is the most liquid period, ideal for momentum-based strategies.
Concept
Premise: The overlap increases volatility as both European and U.S. traders are active, often leading to trend continuations or significant breakouts.
Objective: Trade breakouts or trend continuations during this high-volume period.
How It Works
Setup:
Monitor price action during the early London session (8:00 AM–10:00 AM GMT) to identify consolidations or trends.
Use your indicator’s BuyEntry/SellEntry levels for breakout setups.
Entry Rules:
Buy: Enter on a breakout above a consolidation high during the overlap, confirmed by volume or a strong candle close.
Sell: Enter on a breakdown below a consolidation low.
Example: If GBP/USD consolidates between 1.2980 and 1.3000 from 8:00 AM to 10:00 AM GMT, buy on a break above 1.3000 at 10:30 AM GMT.
Take-Profit and Stop-Loss:
Take-Profit: Target 1-2x the consolidation range or use your indicator’s TP levels (e.g., BuyTP2).
Stop-Loss: Place below the consolidation low (for buys) or above the high (for sells).
Example: Buy at 1.3005, TP at 1.3050, SL at 1.2975.
Exit Rules:
Exit at the target or trail the stop during the overlap period.
Close positions by 11:00 AM EST if momentum fades.
Tips for Implementation
Timeframe: M5 or M15 for quick entries during the overlap.
Pairs: GBP/USD, EUR/USD, USD/JPY for high liquidity.
Indicators: Combine with your breakout indicator and add volume or ATR to confirm momentum.
Pros and Cons
Pros: High liquidity reduces spreads; strong moves during overlap.
Cons: Fast-paced; requires quick decision-making.
General Tips for London Session Trading
Broker Considerations: Choose a broker with tight spreads during the London session, as volatility can widen spreads.
Economic Calendar: Avoid trading during major news releases (e.g., UK GDP, ECB rate decisions) unless you specialize in news trading, as they can cause unpredictable spikes.
Time Zone Awareness: Adjust your indicator’s StartTime, EndTime, and SessionEndTime to match your broker’s server time. For example, if your broker’s server is GMT+2, shift times accordingly.
Backtesting: Test strategies on a demo account using historical London session data. Your indicator’s NumDays = 200 setting can help analyze past sessions.
Risk Management: Limit risk to 1-2% per trade, and use position sizing based on stop-loss distance.
How Your Indicator Enhances These Strategies
Your MQL4 indicator is tailored for the London Breakout Strategy but can also support other strategies:
Breakout Strategy: The indicator automates range identification (boxHigh, boxLow), entry signals (BuyEntry, SellEntry), and target levels (BuyTP1 to BuyTP5). The ShowBreakoutArrow and ShowTP5Cross features provide visual cues for entries and exits.
Trend Continuation: Use BuyEntry/SellEntry as confirmation for trend-aligned breakouts.
Range Reversal: The Fibonacci levels (OBJ_FIBO) and TP levels (e.g., BuyTP3, SellTP5) can identify potential reversal zones.
London-NY Overlap: The indicator’s session box (tSessionStart to tSessionEnd) can highlight the overlap period for breakout setups.
To align the indicator with other strategies:
Add trend filters (e.g., a moving average check in check_breakouts_and_tp5).
Modify show_boxes to plot pivot points or additional Fibonacci levels for reversal setups.
Example Trade Setup (London Breakout with Indicator)
Pair: GBP/USD, M15 chart
Time: 8:00 AM GMT, September 30, 2025
Indicator Settings: StartTime = "06:00", EndTime = "08:00", MinBoxSizeInPips = 15, TP1Factor = 1.0, SLFactor = 1.0
Scenario: Indicator identifies a range of 1.3050 (high) to 1.3020 (low). At 8:15 AM GMT, price breaks above 1.3050, triggering a buy arrow.
Action: Enter long at 1.3055, set TP1 at 1.3075 (20 pips), SL at 1.3020 (35 pips).
Outcome: Price hits TP1 at 9:00 AM GMT, or monitor for TP3 (e.g., 1.3102) if momentum continues.
Download here : https://discord.gg/9wYhsZHMWN
Share